Customer Segmentation and Churn Risk Analysis
A customer segmentation project using K-Means clustering to group users based on behavior and uncover actionable insights.
About the Project
Project Overview
- Conducted a customer segmentation project using cluster analysis on the Telco Customer Churn dataset.
- Applied the K-Means clustering algorithm to group customers based on their demographic, service usage, and billing characteristics.
- Used the Silhouette Method to determine the optimal number of clusters.
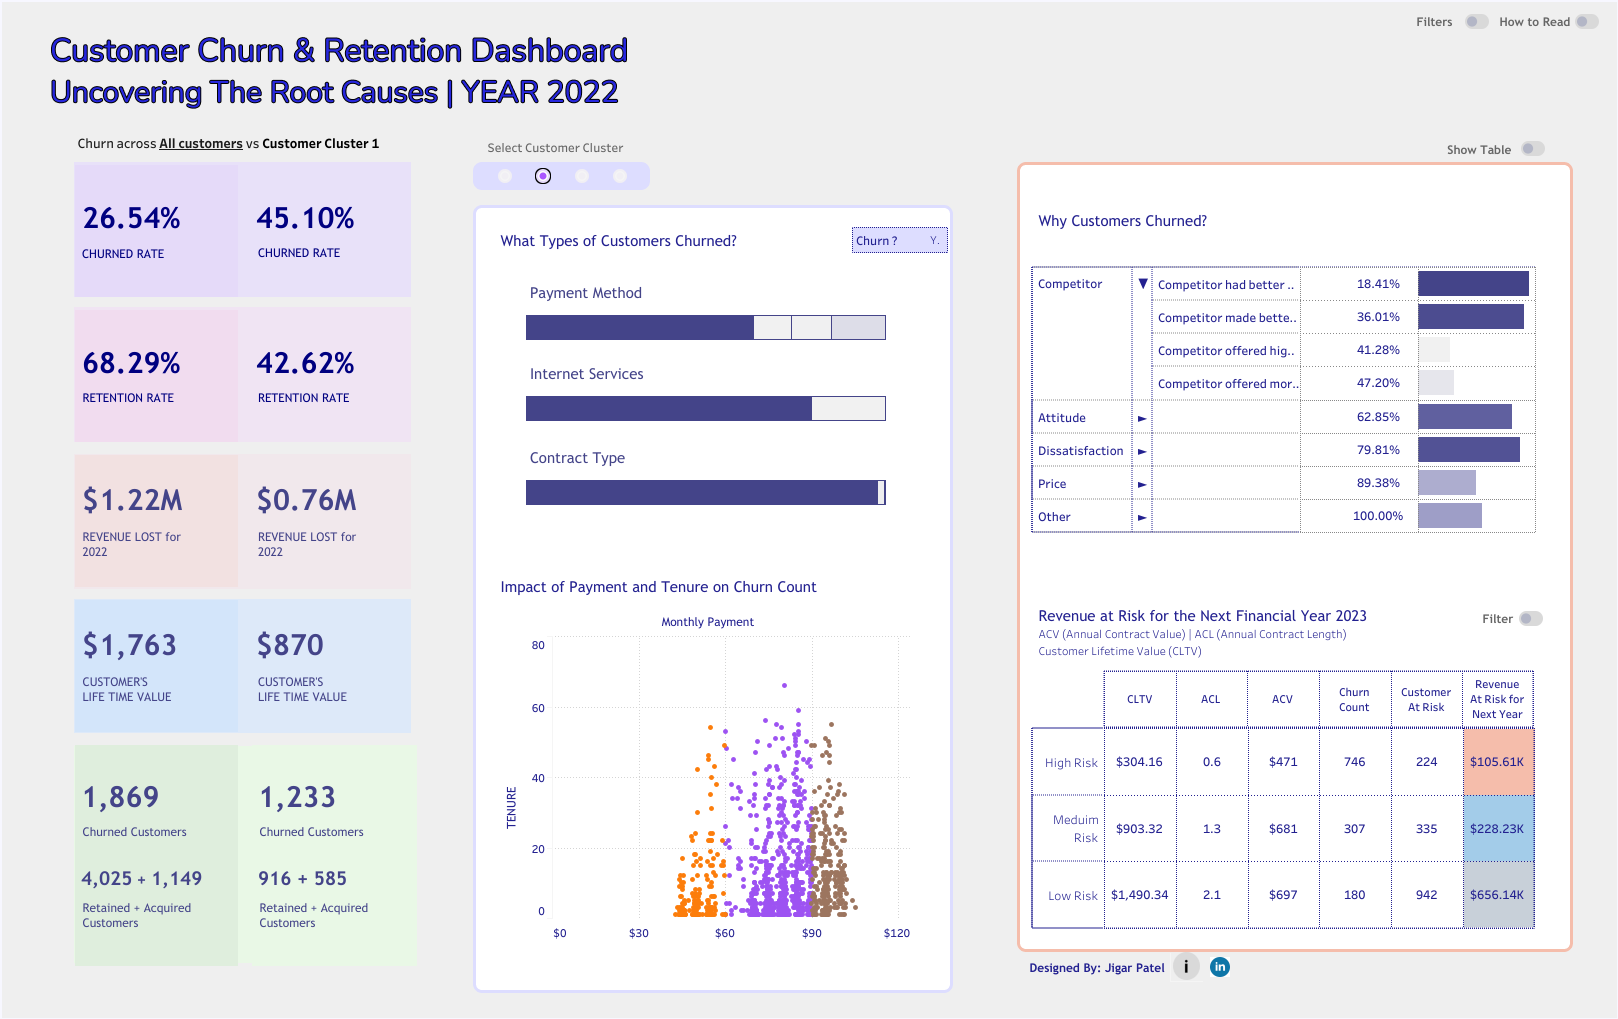
- Developed an interactive Tableau dashboard to visualize churn risk and revenue at risk across customer segments.
Challenges
- Converted mixed data types (categorical + numerical) into a consistent format for clustering.
- Handled missing values in the TotalCharges column by imputing values with MonthlyCharges.
- Encoded categorical variables using LabelEncoder for model compatibility.
- Standardized numerical features using StandardScaler to ensure fair distance calculations in clustering.
- Balanced business interpretability with statistical validity in defining clusters.
Technology Used
- Python (NumPy, pandas, matplotlib, scikit-learn) for preprocessing, clustering, and model evaluation.
- Jupyter Notebook for step-by-step development and exploratory analysis.
- Tableau for creating interactive dashboards on churn and revenue at risk.
Outcome
- Generated a clean, structured dataset with transformed categorical and numerical variables.
- Built a K-Means model with 4 clusters validated using silhouette scores.
- Labeled customers into clusters, enabling insights on churn drivers and customer profitability.
- Exported the enriched dataset (final_data.csv) for integration with visualization tools.
- Created a Tableau dashboard to provide an executive-level view of customer churn, tenure, and contract-related risks.
Key Findings
- Cluster Profiles: Four distinct customer groups were identified, each with unique churn behaviors and service usage patterns.
- High-Risk Segments: Customers on month-to-month contracts and paying through electronic check showed significantly higher churn rates.
- Revenue at Risk: Certain clusters contained high-value customers with higher churn probability, signaling the need for retention offers.
- Tenure Effect: Longer-tenure customers exhibited lower churn, reinforcing loyalty benefits over time.
- Service Patterns: Internet service type (DSL vs. Fiber) and add-on services (Tech Support, Online Security) strongly influenced churn distribution across clusters.
Key Features
- Data preprocessing pipeline: cleaning, imputing, encoding, and scaling.
- Automated clustering workflow with K-Means and evaluation using silhouette scores.
- Exported enriched dataset for business-ready analysis.
- Interactive Tableau dashboard visualizing churn rates, customer revenue, and risk distribution by cluster.
- Actionable segmentation insights to support churn reduction and revenue optimization strategies.
Technologies Used
Python
K-Means Clustering
Customer Segmentation
Tableau