Cricket Player Performance Analysis
A comparative performance analysis of Sachin Tendulkar and Virat Kohli using data scraped from ESPN Cricinfo.
About the Project
Project Overview
- Conducted a comparative performance analysis of cricket legends Sachin Tendulkar and Virat Kohli.
- Analyzed performance across different match formats, including Tests and ODIs.
- Collected, cleaned, and processed detailed match-by-match data.
- Visualized insights to understand patterns in batting performance, consistency, and scoring trends.
Challenges
- Scraped a mix of structured and unstructured data from ESPN Cricinfo.
- Handled and cleaned missing or inconsistent data points.
- Standardized data across different match formats and innings.
- Designed clear, interactive visualizations for meaningful comparisons of multiple metrics.
Technology Used
- Python (requests, BeautifulSoup, pandas) for web scraping, data cleaning, and preprocessing.
- Tableau for creating interactive dashboards and performing visual analysis.
Outcome
- Produced a comprehensive dataset with detailed batting records for both players.
- Developed an interactive Tableau dashboard to explore trends and compare performance.
- Enabled both high-level and game-level analysis of player statistics.
Key Findings
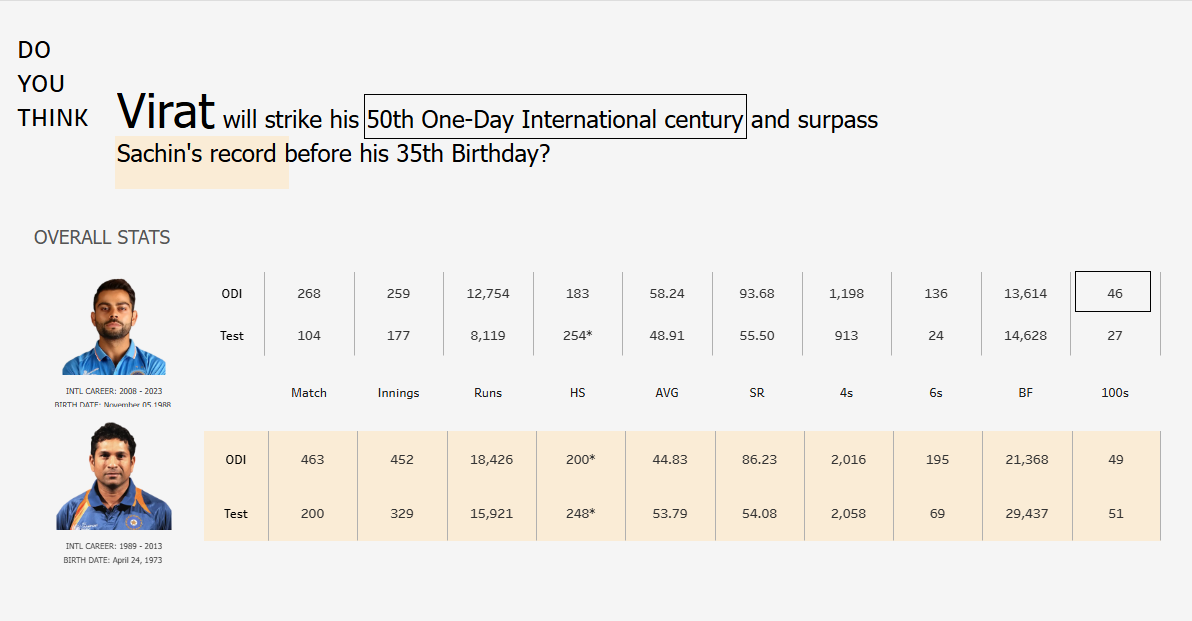
- Overall Stats Comparison:
- Virat Kohli and Sachin Tendulkar’s ODI and Test match career statistics are compared side-by-side.
- Virat has played 268 ODIs and 104 Test matches as compared to Sachin's 463 ODIs and 200 Tests.
- Virat has scored 12,754 runs in ODIs with an average of 58.24 and 8,119 runs in Tests averaging 48.91.
- Sachin holds higher career totals, e.g., 18,426 ODI runs averaging 44.83 and 15,921 Test runs with an average of 53.79. Performance Over Age:
- Scatter plot shows Virat Kohli’s and Sachin Tendulkar’s batting strike rate and century scores across ages 16-38.
- Virat’s performance seems consistently strong and comparable to Sachin’s past form with variances in certain ages.
- There are key noted nervous nineties and century points (data points) highlighting critical batting moments. Runs Over Age:
- Runs accumulated by age demonstrate how both players have produced runs across their careers.
- Virat’s runs build quickly starting early 20s, roughly paralleling Sachin, showing a fast start to his career tally. Centuries Progression:
- Graph shows a cumulative count of centuries scored over age.
- Sachin scored 49 ODI centuries by age 38; the data suggests Virat is on track to potentially surpass this record by his 35th birthday. Batting Average and Strike Rate Trends:
- Batting average fluctuates over age but shows overall strong outputs from Virat, sometimes exceeding Sachin’s peak at similar ages.
- Strike rate comparison suggests Virat’s aggressive style translates to higher runs per 100 balls, especially in his late 20s and early 30s. Batting Average Against Opponents:
- Comparisons of batting averages for both players against various international teams (Australia, Bangladesh, England, etc.).
- Virat has competitive or higher averages vs many teams, showing his adaptability. Batting Average in Host Countries:
- Differences in batting averages for matches played in various host countries are charted.
- Both players show variations largely influenced by local conditions, with notable stronger averages in certain countries for each.
Key Features
- Automated data scraping pipeline for multiple players and formats
- Cleaned and structured dataset for analysis
- Interactive Tableau dashboard to visualize player performance metrics
- Comparative analysis by format, opposition, and venue
- Insightful trends to highlight strengths, weaknesses, and consistency
Technologies Used
Python
Tableau
Web Scraping
Data Analysis
Data Visualization