Tableau VOTD Analysis & Automation
An automated data pipeline to featch realtime time data evry day and analysis of Tableau's 'Viz of the Day' (VOTD) to identify top authors.
About the Project
Project Overview
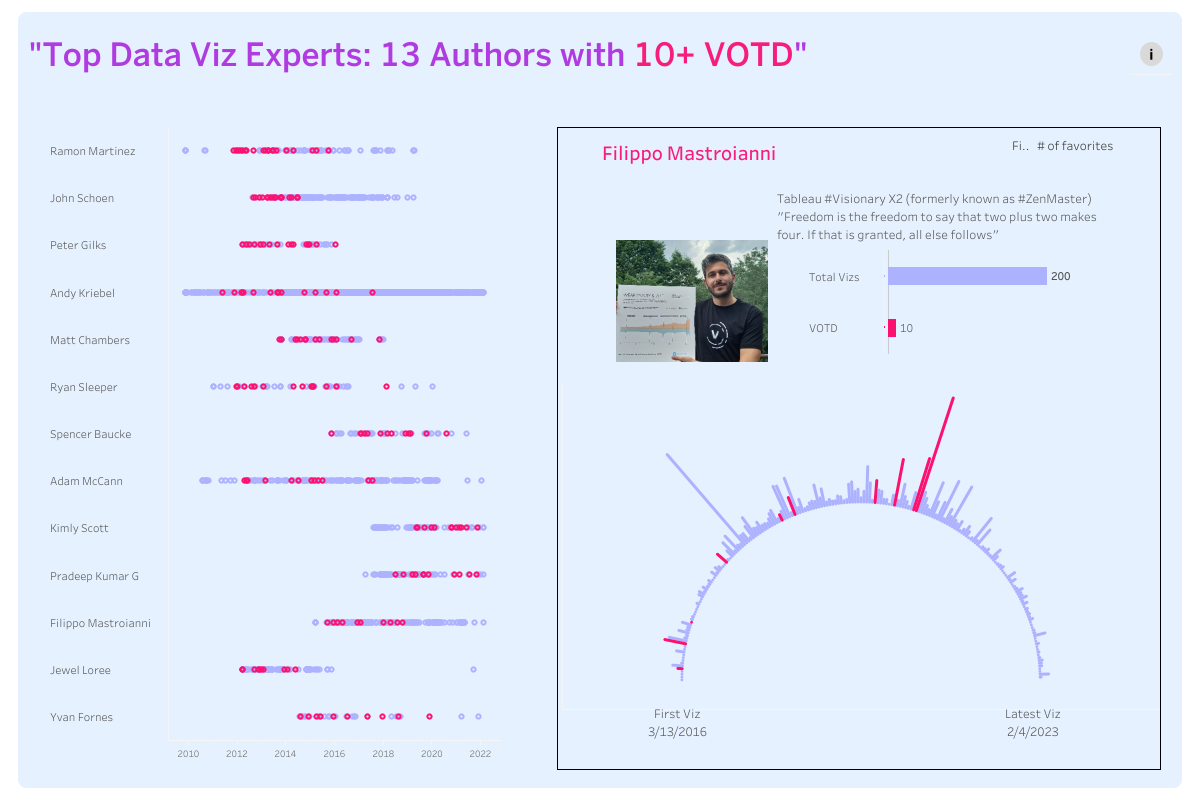
- Retrieved and analyzed all Tableau 'Viz of the Day' (VOTD) data to identify authors with 10 or more awards.
- Built an automated pipeline to fetch the latest VOTD data daily and update a Google Sheet, creating a live historical dataset.
Project Steps
- Part 1: Extracting and Preparing Tableau VOTD DataSetup Environment:
- Install Python 3 and Tableau Desktop.
- Install necessary Python libraries: pandas, numpy, requests, BeautifulSoup, etc. Retrieve VOTD Data:
- Use Tableau Public API to fetch Viz of the Day (VOTD) data.
- Get the list of authors with at least 10 VOTDs.
- Retrieve all visualizations for those authors.
- Extract additional metadata for each visualization, including title, URL, and date. Data Processing:
- Combine all author-level data into a single dataframe.
- Clean and standardize the dataset for analysis. Part 2: Automating VOTD Updates in Google SheetsSetup Environment:
- Install Python libraries: gspread, google-auth, pandas, requests, schedule, datetime, etc.
- Enable Google Sheets API and set up ServiceAccountCredentials. Authenticate & Connect:
- Authenticate using Google Service Account credentials.
- Open the target Google Sheet to update. Retrieve VOTD Data from Tableau:
- Make API calls to Tableau’s Gallery API to fetch the latest VOTD data.
- Store the data in a Python list. Update Google Sheet:
- Check if the first workbook URL is already present in the sheet.
- If not, insert all VOTD data; if yes, insert only new entries.
- Convert the data to a list of lists and append to the sheet. Logging:
- Append a log row in the Update_Log worksheet with timestamp and number of rows inserted. Automation:
- Schedule the Python script to run automatically using task scheduler or cron, ensuring the Google Sheet stays updated with new VOTDs. Part 3: Visualization in TableauConnect the Google Sheet as a data source in Tableau Desktop:
- Build interactive dashboards to visualize top authors, total VOTDs, trends over time, and other performance metrics.
- Enable dynamic filtering and drill-downs for deeper insights into author contributions and visualization trends.
Challenges
- Worked with Tableau's unofficial public API to extract the required data.
- Set up secure authentication for the Google Sheets API.
- Created a reliable, scheduled script for daily data updates with robust error handling.
Technology Used
- Python (Pandas, Requests, gspread, oauth2client) for data extraction and automation.
- Unofficial Tableau Public API for data sourcing (developed by wjsutton: http://github.com/wjsutton/tableau_public_api).
- Google Sheets API for live data storage.
- Tableau Desktop for visualization.
- Used a task scheduler to run the Python file on a schedule to update data in Google Sheets.
Outcome
- Created a Tableau dashboard showcasing the top VOTD authors in the community.
- Developed an automated system that maintains a live, up-to-date dataset of all VOTD winners.
- The dataset is valuable for ongoing community analysis and trend-spotting.
Key Features
- Data retrieval from Tableau's unofficial public API
- Identification of top authors with 10+ VOTD awards
- Automated daily data extraction to a Google Sheet
- Secure authentication with Google Sheets API
- Interactive Tableau dashboard for visualization
Technologies Used
Python
Tableau
API
Data Automation
Google Sheets