Turning Data into Insights
Hi, I'm Jigar Patel
I'm a Data Analyst and AI practitioner passionate about transforming complex data into clear, actionable stories that drive business decisions.
Technical Skills
My toolkit for building and analyzing.
Data Analysis & Programming
Data Visualization
AI & Machine Learning
Tools & Technologies
Currently Learning
Work Experience
- Increased subscriber base by 74% by analyzing campaign performance and identifying high-converting channels through cohort and funnel analysis.
- Ran A/B tests on email subject lines and CTAs, increasing open rates from 40% to 60% and click-through rates by 25%.
- Developed Tableau dashboards to track product-specific and website behavioral KPIs, including page views, session duration, click-through rates, and newsletter engagement, guiding product decisions that improved content consumption.
- Built automated Python data pipelines enabling real-time data processing from multiple sources, reducing reporting time by 80%.
- Integrated Google Analytics data to monitor website traffic patterns, user engagement, audience demographics, and web page performance, providing actionable insights for marketing strategy.
Building prototype AI-Powered PR/NOC Guidance Tool
- Built and deployed a GenAI chatbot using OpenAI and LangChain for PR/NOC guidance, enabling natural language queries on immigration programs. Demo Video
- Enhanced response accuracy through prompt engineering, RAG techniques, and integration of structured (government data) and unstructured sources (policy docs, news).
- Prototyped a PR Bundling Web App with Firebase Studio (Gemini AI) to consolidate Canadian PR draws and provide role-based eligibility search (e.g., “PR pathways for a welder in Ontario”).
Business Intelligence Analyst
Joe Johnson Equipment
Mar 2023 - Apr 2024- Built and maintained 15+ automated dashboards in Power BI and Dynamics 365 to track pipeline health, win/loss rates, ARR/ACV trends, and sales metrics, improving decision-making efficiency by 40%.
- Partnered with Sales, Finance, Service, and HR teams to monitor quota attainment, funnel conversion, and pipeline coverage, providing leadership with actionable insights to guide GTM strategies.
- Automated sales quote generation in Dynamics 365 with Power Automate, reducing quote creation time by 90% (from 30 minutes to under 3 minutes), streamlining the lead-to-close process.
- Leveraged SQL for ad hoc analysis and cross-functional reporting, generating insights on revenue trends, funnel performance, and operational KPIs to support leadership decision making.
- Developed custom dashboards, reports, and process automations using Power Apps and Power Automate to improve GTM workflows, pipeline visibility, and cross-functional collaboration.
BI Analyst
Simcoe Muskoka District Health Unit
May 2021 - Sep 2022- Cleaned and standardized COVID-19 datasets using Excel/Power Query, ensuring 100% compliance with health reporting standards.
- Built Tableau dashboards tracking daily infection rates, ICU capacity, and test positivity, helping reduce intervention response times by ~20%.
Data Analyst (Freelance)
Analytics Tale (E-commerce)
Feb 2021 - Jan 2022- Advised e-commerce leadership on data-driven growth strategy by analyzing 14 months of customer, sales, & ad campaign data.
- Segmented customer cohorts and optimized ad spend across channels, helping drive a 3.5x year-over-year revenue increase.
- Delivered the company's first-ever sales dashboard, improving visibility on sales trends, AOV, and customer retention metrics.
Featured Projects
A selection of my work in data and web development.
A customer segmentation project using K-Means clustering to group users based on behavior and uncover actionable insights.
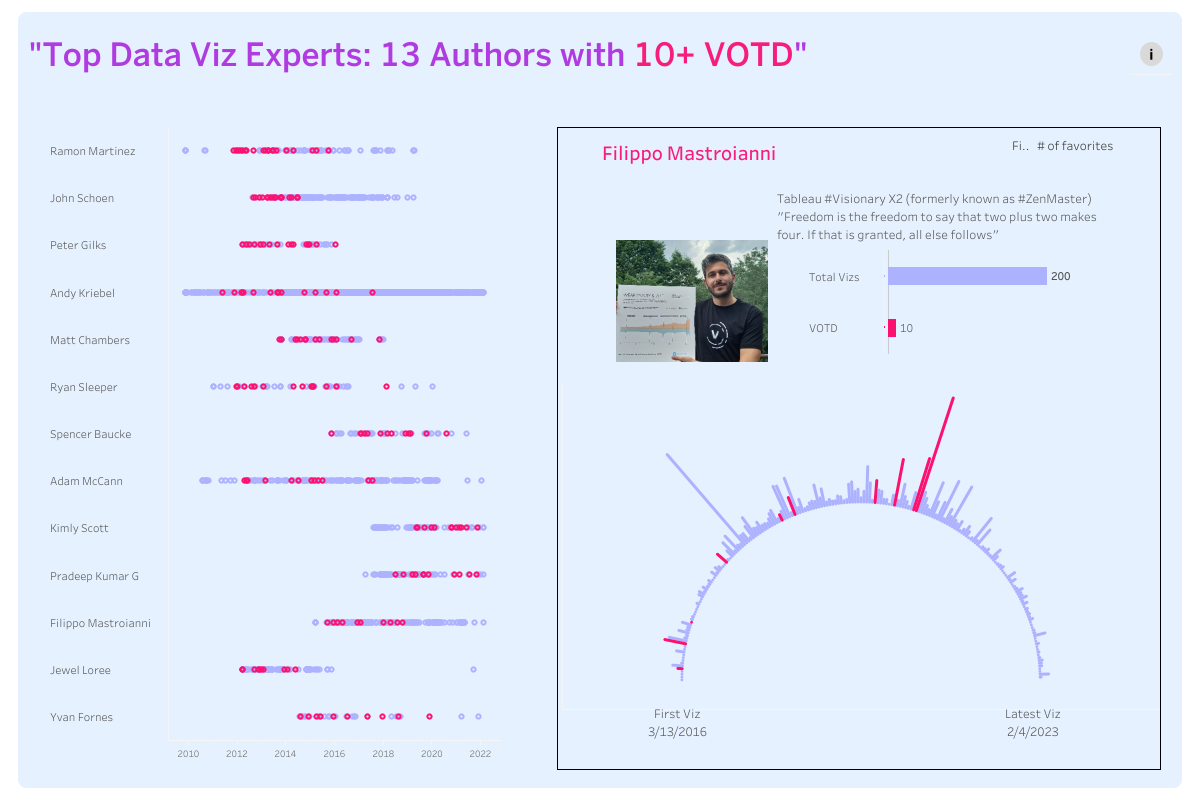
An automated data pipeline to featch realtime time data evry day and analysis of Tableau's 'Viz of the Day' (VOTD) to identify top authors.
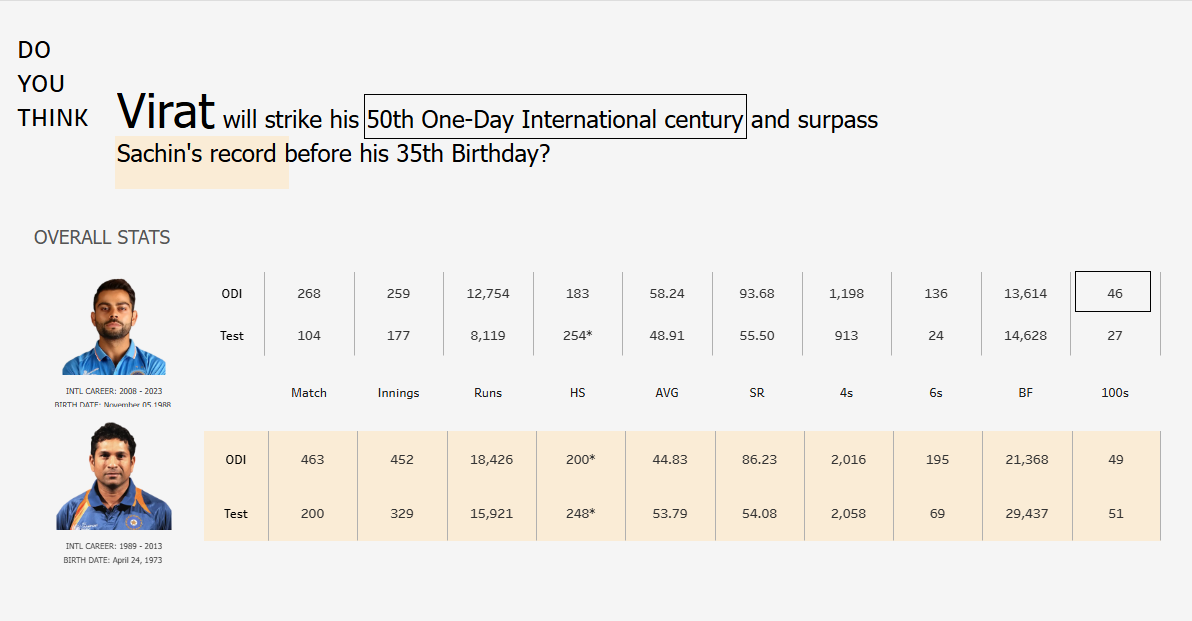
A comparative performance analysis of Sachin Tendulkar and Virat Kohli using data scraped from ESPN Cricinfo.
Interactive Dashboards
Explore the data and uncover insights for yourself.
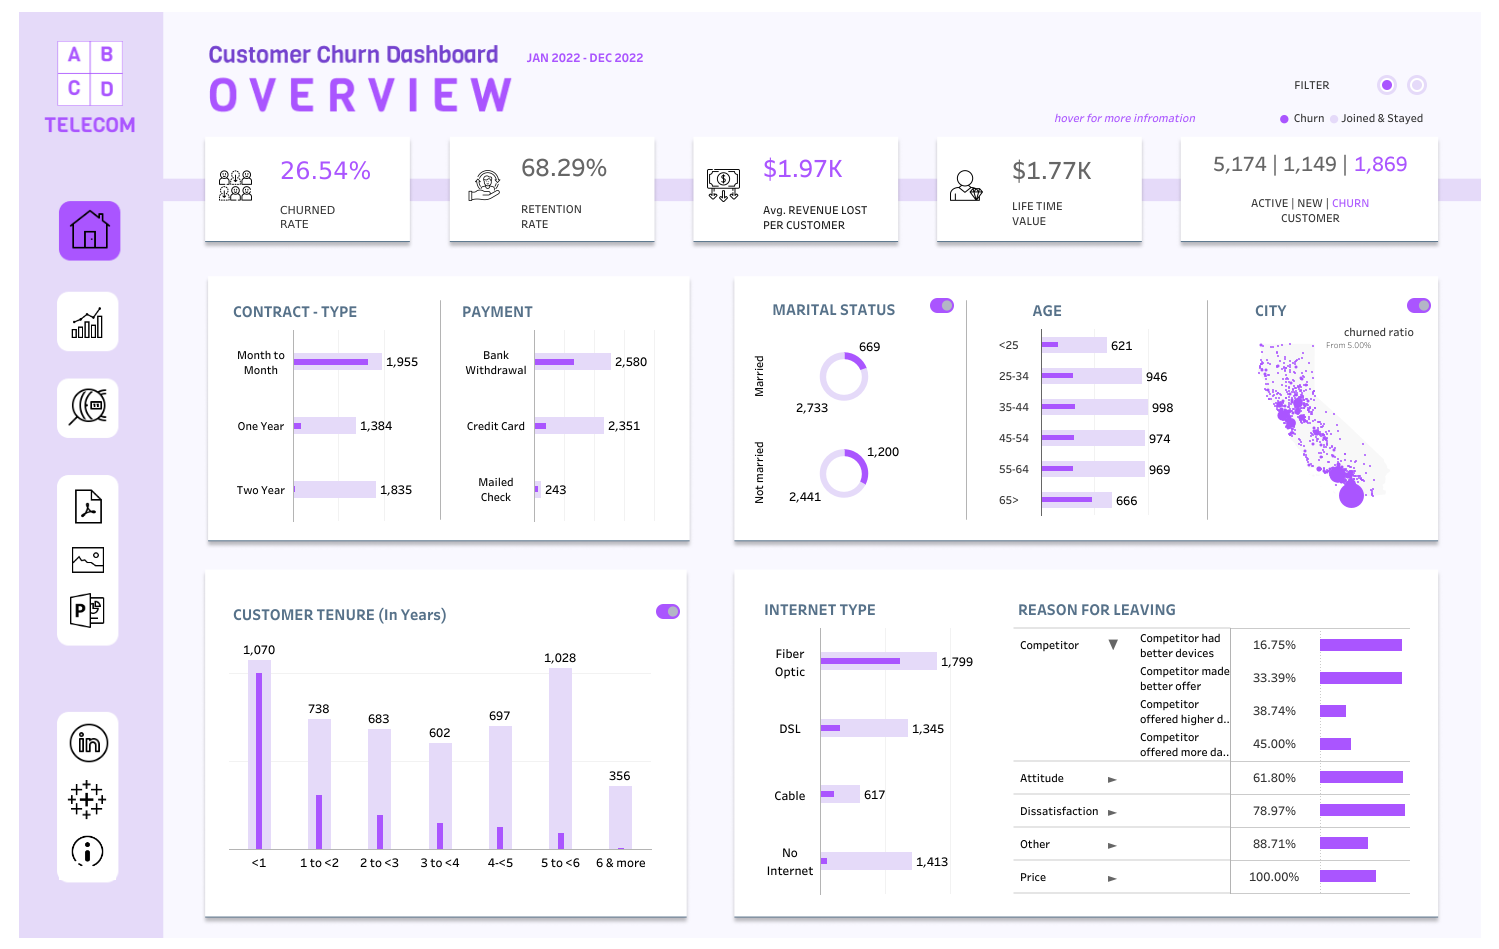
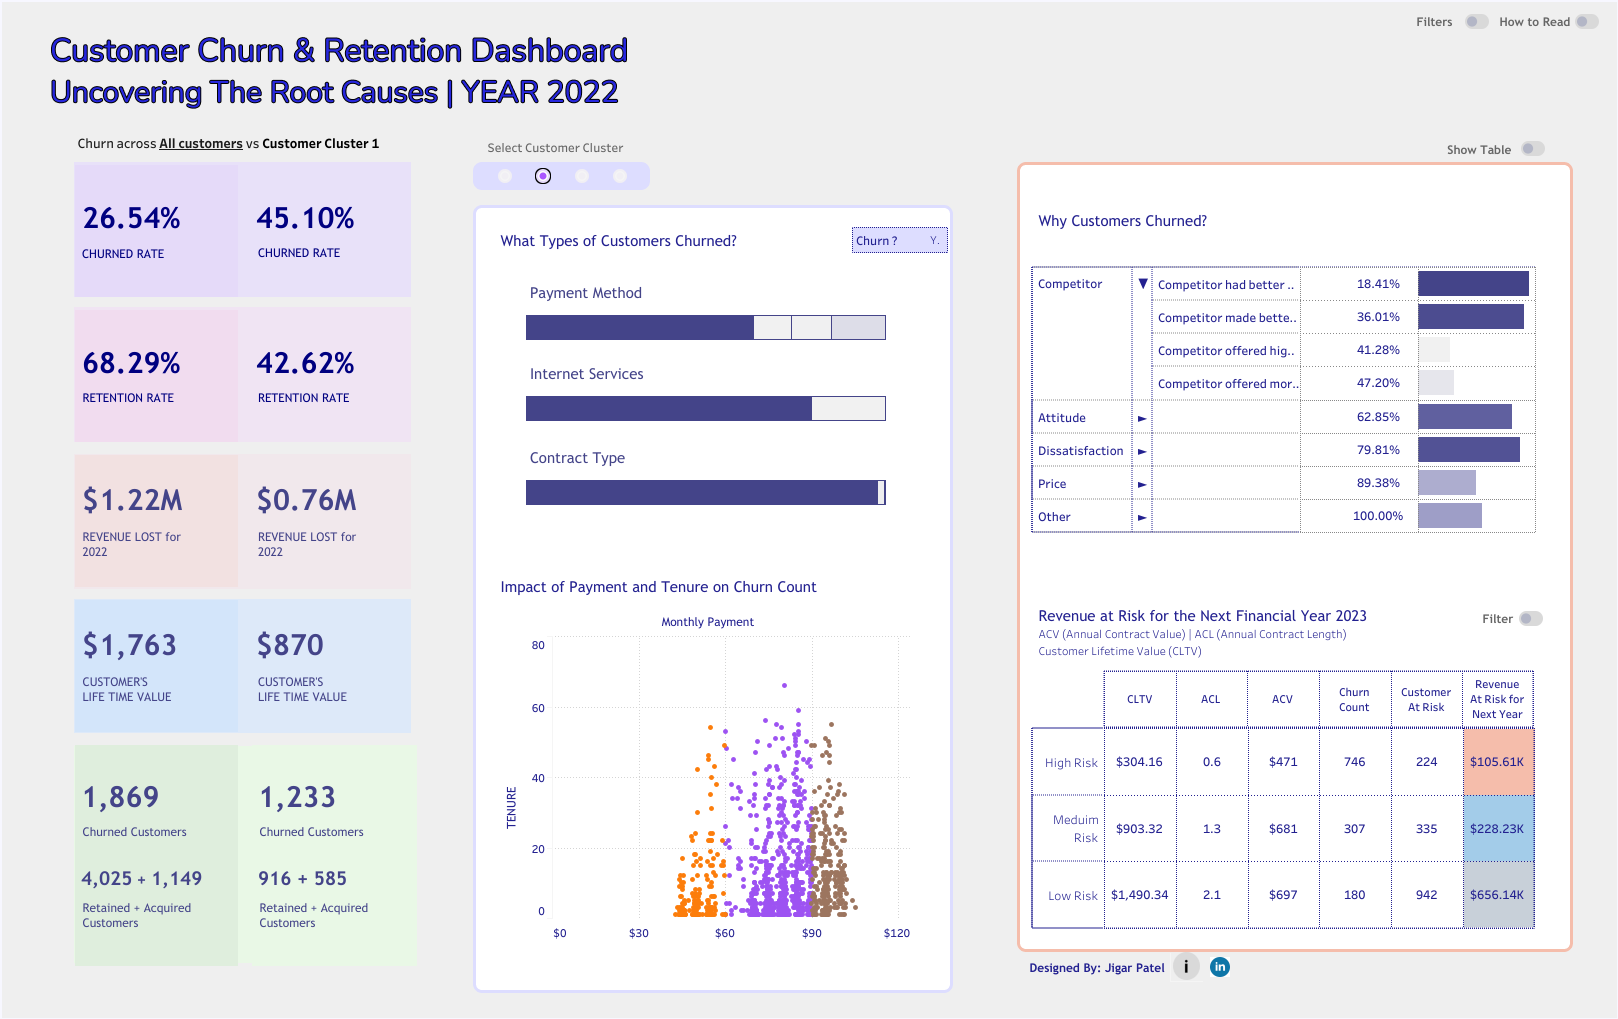
Churned Dashboard
The Churned Dashboard provides an overview of customer churn, highlighting the number and percentage of customers lost over time. It features a What-If analysis projecting potential revenue risk based on varying churn scenarios. The dashboard also includes a detailed tab showing individual customer churn probabilities, enabling targeted retention efforts. These insights help businesses understand churn dynamics and forecast financial impact. This tool supports proactive strategies to reduce churn and protect revenue.
Medium Blog
Sharing insights on data, analytics, and AI.
Snowflake SQL Interview Question: Marketing Touch Streak
In this article, I am explaining how I solved a SQL challenge to identify CRM contacts who had marketing touches for three or more consecutive weeks and at least one ‘trial_request’ event, using date functions, window functions, and table joins.
Facebook SQL Interview Question: Page Recommendation
I worked on a SQL challenge to build a page recommendation system based on users’ friendships and the pages their friends follow. The goal was to recommend the most popular page among friends that the user hasn’t yet followed, using two-way friendship relationships, ranking with window functions, and filtering out already followed pages.
Education
Master of Science in Statistics
The Maharaja Sayajirao University
Focused on hypothesis testing, probability theory, statistical distributions, machine learning, and databases.
Postgraduate Certificate in Big Data Analytics
Georgian College
Focused on big data technologies including Hadoop, Spark, and Scala.
Certifications
dbt Fundamentals
dbt Labs
Generative AI Fundamentals
Databricks
SQL (Advanced)
HackerRank
Machine Learning
Stanford University / Coursera
Interests & Hobbies
Get In Touch
Let's connect, solve and build something amazing.
I'm always open to discussing new projects, creative ideas, or opportunities to be part of an ambitious team. Feel free to reach out.